
study guide · scalability in 6 stages
Server scalability
through the F1 lens.
This guide teaches server scalability in six stages. You start by separating performance, optimization and scalability and comparing vertical and horizontal scaling; then you study load balancers (algorithms, failover, canary and blue/green), state outside the server with Redis, queues and workers, the CDN edge, database scalability (read replica, cache-aside, sharding, CAP, RPO and RTO) and, finally, the complete architecture with metrics, logs and request tracing. Before the stages, the next section introduces the F1 lens of the guide: a general comparison that shows the same system working inside a Formula 1 team.
Each stage depends only on what was explained before it and ends with a "Hands-on" block: a lab and exercises with an expected answer. Scalability is learned by measuring, so run the commands and compare the numbers.
Prerequisites:
Lab folder structure (you will create it gradually):
All commands start from the lab-escalabilidade folder, unless the stage tells you to enter its own folder.
The F1 lens of this guide
The operations room that handles the peak
During a Grand Prix weekend (the championship round, with free practice, qualifying and the race), a Formula 1 team works in two places at the same time. At the circuit there are the garage, where the mechanics prepare the two cars, and the pit wall, the gantry facing the track where the engineers follow the session. At the factory there is the remote operations room, where several analysts look at the same data in real time. The two places talk over a single data link: if it goes down, the garage is cut off from the factory.
Each car sends telemetry (the sensor data, transmitted continuously) to the team servers. The race engineer (who follows one car and talks to the driver over the radio) needs answers all the time: how worn the rear tire is, what pace the car ahead has, whether it is worth pitting this lap. Most of those questions are not answered at the circuit. They travel over the link to the operations room at the factory.
When the room receives more questions than it can answer, there are two ways out. One is to give an analyst a more powerful computer, which has a limit and leaves that desk idle during the swap. The other is to add more identical analysts, working in parallel.
At the room entrance, a coordinator receives each question and hands it to a free analyst. From time to time he checks with each desk whether it is working, and when a desk goes down, the following questions go to the others. A new analysis tool is used first on one car only, in free practice, and only afterwards on both.
So that any analyst can continue another's work, nothing stays in anyone's head: the context of each question is in the team's shared data system. Slow work, such as a strategy simulation repeated thousands of times, is not done while the engineer waits. The request goes into the queue of the simulation computer cluster, the room answers "received", and each machine takes one request at a time. When the queue grows, the team turns on more machines.
The material the circuit consults all the time (the circuit map, the tire reference data) does not cross the world on every query. The servers the team takes to the circuit keep a local copy, with an expiry date, and the factory can order it discarded before the deadline when the original changes.
The car specification sheet (the official record of every part and every adjustment) has a single official version, at the factory, and changes are made only there. The garage consults read copies, updated shortly afterwards and, for a few moments, behind. If the link to the factory goes down, the garage has to choose: keep working with the copy it has, possibly outdated, or wait for the link to return so as not to decide with old data.
To understand what is happening, the team looks at three records: the telemetry, with the numbers from each sensor throughout the session; the event diary, with what happened and at what time; and the protocol number each question receives when it enters the room, which allows reconstructing which desks it passed through and how long it stayed at each one.
It is the same division of labor as a scalable system. Each question is a request, the operations room is the server fleet and the coordinator at the entrance is the load balancer. Taking the context out of the analyst's head is making the server stateless, and the simulator queue is the queue with workers. The copy at the circuit is the CDN, the official sheet and its copies are the primary database and the read replicas, and the three records are observability. The table below translates each term of the guide into plain words, and the "Where the comparison stops" section, right after it, shows what F1 does not cover in each stage.
One fixed rule holds for the whole guide: each analyst in the room is a replica of the server. All are equal and interchangeable, and none keeps alone what another will need.
The terms in plain words
71
The table below translates each technical term of the guide into an everyday idea, with no F1 and no jargon. You do not need to memorize it; come back to it whenever a term shows up in the text.
| Technical term | In plain words |
|---|---|
| Performance (latency) | How long it takes to serve one person alone, like the minutes a cashier spends ringing up one customer's groceries. |
| Throughput | How many people are served per minute in total, adding up all the open cashiers. |
| Optimization | Making the same task cost less without hiring anyone, like the cashier who learns a faster way to scan products. |
| Scalability | The ability to serve more people when resources are added, like the store that opens more cashiers when the line grows. |
| Trade-off triangle | In a renovation you want it fast, cheap and simple, and you rarely get all three together. With servers it is the same: performance, cost and complexity. |
| Vertical scaling | Swapping the kitchen stove for a bigger one. It is simple, but there is a maximum size and, during the swap, the kitchen stops. |
| Horizontal scaling | Opening more identical kitchens and splitting the orders among them. |
| Single point of failure (SPOF) | The only bridge connecting a neighborhood to the rest of the city: if it closes, nobody gets through. |
| Elasticity and autoscaling | Opening and closing cashiers according to the traffic, following rules agreed beforehand, instead of someone deciding on the spot. |
| Karpenter | The manager who, when cashiers are missing, provides exactly the counter size the line calls for, choosing the cheapest one available at that moment. |
| FinOps | Looking at the electricity bill together with the comfort of the house: deciding how much each gain is worth spending, instead of leaving everything on at maximum. |
| Load balancer | The person who organizes the bank line and tells each customer which window is free. The customer only knows the line, not the windows. |
| Layer 4 and layer 7 | At layer 4, the mail carrier delivers by looking only at the address on the envelope. At layer 7, the secretary opens the letter and forwards it to the right department according to the subject. |
| Round-robin | Dealing the cards one to each player around the table, without looking at who already has more. |
| Weighted Round-robin | The same rotation, but with weights: the cook who can handle triple gets three orders per round, and the others get one. |
| Least connections | Sending the next customer to the cashier who is serving the fewest people at that moment. |
| IP hash (session affinity) | Each customer is always served by the same branch manager, chosen by a calculation on their number. |
| Health check | The question asked from time to time at each window, "can you serve?"; whoever does not answer stops receiving customers. |
| Failover | When a window suddenly closes, the next customers are sent to the others without noticing. |
| Connection draining | Before closing a window, finishing the service of those already there, without calling anyone new. |
| Blue/Green | Two identical stores side by side and a sign at the entrance pointing to one of them. Flipping the sign moves all customers at once, and flipping it back is just as fast. |
| Rollback | Undoing a change and going back to the previous version that worked, like putting the furniture back in the old place when the new arrangement did not work. |
| Canary | Serving the new recipe first to one table in ten and watching the reaction before changing the whole menu. |
| Ingress | The board at the building entrance that says: "orders, room 2; everything else, reception". |
| Stateful | The attendant who keeps your order in their head: only they can continue the service. |
| Stateless | The order written on a ticket left on the counter: any attendant reads it and continues. |
| Sticky session | Forcing the customer to always return to the same attendant, because only that one remembers the order. |
| Redis | A quick message board in the middle of the kitchen, which all the cooks read and write. |
| ReplicaSet and Auto Scaling Group | The manager's rule "always three cashiers open": if one closes, another opens in its place. |
| Queue and worker | The orders hung on the kitchen clothesline and the cooks who take one at a time to prepare. |
| Producer and 202 response | The waiter who writes down the order, hangs it on the clothesline and says "received"; the dish arrives later. |
| KEDA | Calling more cooks when the order clothesline fills up and dismissing them when it empties. |
| Sidecar | An assistant who works next to the cook writing down everything that goes out, without the cook having to stop for it. |
| Ambassador | The agent who handles all the company's dealings with outside offices, including insisting when the call drops. |
| Service mesh | An internal telephone exchange: every call between departments goes through it, and it repeats the call when it drops, limits the waiting time and records everything, without each department having to do it alone. |
| Retry with exponential backoff | Calling again when nobody answers, waiting 1, then 2, then 4 minutes, so as not to congest the line. |
| Jitter | Adding a few random seconds to the wait before calling again, so that many people who called at the same time do not all insist at the same instant. |
| Fallback | The plan B agreed beforehand: if the dish ran out, the house option is served. |
| Circuit breaker | The house's breaker: after repeated failures it trips, and nobody plugs appliances back into that outlet until the breaker is switched back on. |
| CDN | A network of bookstore branches that keep copies of the most requested books close to each neighborhood. |
| Origin | The central warehouse, where the originals are kept. |
| PoP (edge) | The neighborhood branch, close to the buyers. |
| Smart DNS | The attendant at the central office who, on learning which neighborhood you are calling from, gives you the address of the nearest branch. |
| Edge computing | The neighborhood branch that, besides keeping books, does small services on the spot (wrapping, writing the dedication) without sending the order to the central warehouse. |
| Cache hit and cache miss | Hit: the branch has the book on the shelf. Miss: the branch has to ask the warehouse, and keeps a copy for the next customer. |
| Cache-Control and TTL | The expiry label the warehouse sticks on each copy, like "valid for one hour". |
| ETag and 304 Not Modified | The edition number of the book. The branch asks "is edition 3 still the current one?" and the warehouse answers "yes, keep using it", without sending another copy. |
| Invalidation (purge) | The recall: ordering all the branches to discard a copy right away, before the expiry date. |
| Cache hit ratio | The percentage of customers served by the branch without it having to ask the warehouse for anything. |
| WAF | The guard at the door who turns away whoever arrives with a kind of attack already known. |
| TLS offload | The lengthy document check done at the front desk, so that the departments inside do not need to repeat it. |
| Primary and read replica | The official ledger, the only one where entries are made, and the copies of it that are updated shortly afterwards and that everyone can consult, without writing in them. |
| Asynchronous replication | The copy is updated shortly after the original, but the original does not wait for the copy's confirmation; for a few moments it may be behind. |
| Write splitting | The house rule: entries only in the official ledger; lookups, in the copies. |
| Cache-aside | Before going to the archive, look at the note on the desk; if there is no note, fetch from the archive and leave a note for next time. |
| Sharding | Splitting the customer files among several cabinets, by letter of the name (range) or by a calculation on the customer's number (hash). |
| Hotspot | The cabinet that everyone opens at the same time, while the others sit idle. |
| CAP theorem and partition | When the phone between two branches goes down, each one chooses: keep serving with the information it has (available, perhaps outdated) or stop until it can confirm with the other (consistent, but stopped). |
| Eventual consistency | A notice posted in several rooms: for a few moments one room still shows the old notice, but in the end all show the same one. |
| Replica promotion (database failover) | The substitute who was following the ledger becomes the main keeper and starts making the entries. |
| RPO | How much work you accept losing, like "if the computer burns, I accept redoing at most the last 5 minutes". |
| RTO | How long you accept being stopped until you are serving again. |
| Serverless | Paying for the taxi ride instead of keeping a car: someone takes care of the vehicle and, with no trip, there is no bill. |
| Monolith | A restaurant with a single kitchen, from which all the dishes come out. |
| Microservices | A food court: each counter does one thing, has its own team and needs to coordinate with the others. |
| Conway's law | The way the company is organized ends up showing in the way the system is divided. |
| Metrics | The numbers on the electricity meter over the month: they show that consumption went up, and when. |
| Logs | The front-desk incident book, with the time and description of each event. |
| Traces | The tracking of a parcel, which shows which centers it passed through and how long it stayed at each one. |
| X-Request-ID | The tracking code printed on the parcel, the same at every center it passes through. |
| SLO and error budget | The goal "the store is open 99.9% of the time"; the remaining 0.1% is the slack for surprises and changes, and when it runs out the priority becomes stability. |
Where the comparison stops
6
The comparison helps fix who does what in an operation that grows, but it is not a perfect equivalence. These are the points where F1 stops holding for each stage:
- Stage 01: adding one more analyst to the operations room takes weeks, and each person works in a different way; a server replica starts in seconds, is identical to the others and can be created and removed by an automatic rule. And extra analysts speed up nothing if all of them wait for the same shared part, like the database: then the problem is one of optimization, not of scale.
- Stage 02: the room coordinator reads the question and uses his own judgment; the load balancer follows a fixed algorithm (round-robin, least connections, IP hash) and only knows what the health check answers, so a server that answers "I'm fine" but returns wrong data keeps receiving traffic. The canary is also not "one car out of two": it sends a chosen percentage of requests to the new version.
- Stage 03: an analyst remembers the context even without writing it down; a stateless server cannot keep anything between requests, and if it does, the load balancer sends the next request to another replica that does not know that state. The simulation queue, besides, is just a list of messages: the one who handles failures, retries with backoff and the circuit breaker is the code, not an operator watching the queue.
- Stage 04: the team hand-picks what it takes to the circuit servers; the CDN edge decides by itself what to keep and for how long, from the
Cache-ControlandETagheaders the origin sends. A response that changes from user to user cannot be kept at the edge, and a TTL that is too long makes the edge deliver stale content until the purge. - Stage 05: the specification sheet changes a few times per session, in the hands of few people; a database receives thousands of simultaneous writes, and replica lag makes a read right after a write show the old data. Sharding, which splits the data itself among several databases, has no parallel in the single sheet, and the choice between consistency and availability in CAP is made in the design, before the failure, and not decided on the spot by someone in the garage.
- Stage 06: the car's sensors already leave the factory transmitting telemetry; in a system, metrics, logs and traces only exist if the code is instrumented, and the
X-Request-IDonly accompanies the request if each service passes it along. The complete architecture also has a cost: each extra piece is one more thing to monitor, pay for and maintain.
Stage 01 performance x scale
Fundamentals of modern scalability
The problem
An app goes viral after a marketing campaign. Millions of users try to access it at the same time and the system goes down. What should be a success becomes frustration and lost revenue: it is a scale failure. Large retailers offline on Black Friday and Twitter's (now X) "Fail Whale" are the classic examples. Technically, those outages usually came from bottlenecks in components that are hard to scale horizontally, such as an overloaded relational database or a payment system that could not handle the concurrency.
Growing along with demand is a business need. But there is a trap: not every slow system has a scale problem. Before buying more machines, you need to know what exactly is slow.
The concept
Three words are often used as if they were the same thing, and they are not. Think of a supermarket:
- Performance is the speed of a single task, that is, the latency of one operation: how many items per minute a cashier scans.
- Optimization is improving performance without adding resources: teaching the cashier to scan 20% faster or reorganizing the products on the shelves.
- Scalability is the ability to increase productivity (throughput) in proportion to the resources added. When the line gets gigantic, having the fastest cashier in the world does not help: more cashiers are opened.
The trade-off triangle. Performance, cost and complexity: it is practically impossible to maximize all three at the same time. A database with top-end hardware and several cache layers raises cost and complexity. Microservices can lower the cost per request at large scale, but bring enormous operational complexity compared to a monolith. The professional's role is to navigate these trade-offs according to the technical and business requirements.
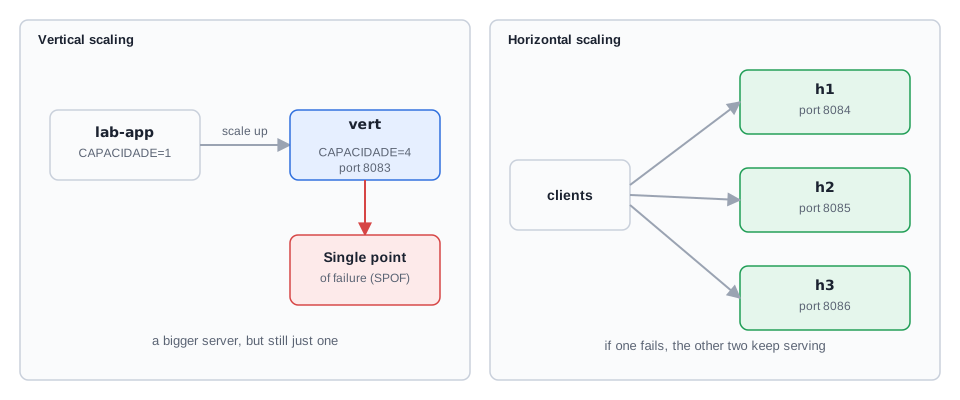
Vertical scaling (scaling up) is enlarging a single server: more CPU, more RAM, faster disks.
- Advantage: simplicity, usually without changing code.
- Disadvantages: physical and financial limit (the next upgrade becomes prohibitive or does not exist), usually requires downtime for the upgrade and creates a single point of failure (SPOF): if the super-server goes down, everything goes down.
Horizontal scaling (scaling out) is adding more servers to distribute the load: a fleet of smaller, cheaper machines.
- Advantage: theoretically unlimited scale and more resilience, since the failure of one instance only redirects traffic to the healthy ones.
- Cost: the application must be designed for a distributed environment (ideally stateless) and operation becomes more complex, with the need for a load balancer (Stage 02).
Elasticity and autoscaling. Elasticity is the ability to grow and shrink resources according to load. Autoscaling is the automated mechanism that implements it, with predefined rules, without an on-call team adding servers by hand. There are three styles:
Automation is the key to cost efficiency: you pay only for what you use.
When NOT to scale. Sometimes the bottleneck is solved with code optimization or a more efficient query. For an internal system with 50 employees and low, stable traffic, autoscaling is overkill in cost and complexity. Telling a scale problem from an optimization problem is a sign of maturity.
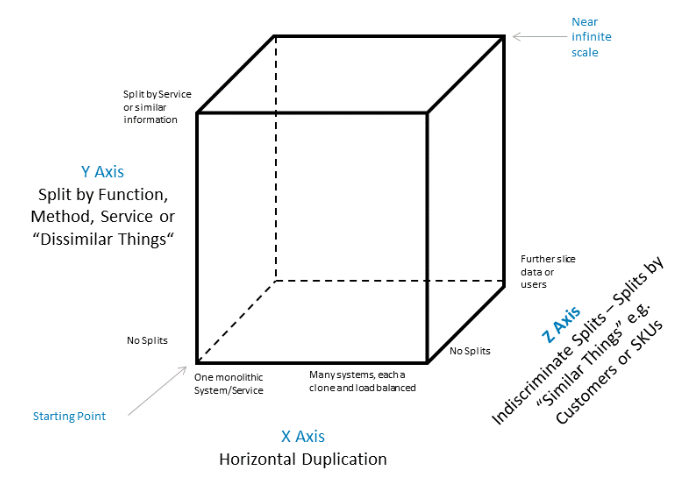
Current challenges and tools. Microservices, containers, event-driven systems and unpredictable seasonal peaks multiply the components: dozens or hundreds of services, each with its own scaling need. Granularity allows scaling only the necessary component (for example, the shopping cart), but brings network latency and observability challenges. The tools cited in the material are Kubernetes (the orchestration standard), AWS Auto Scaling Groups (ASG, elasticity in the cloud), Karpenter (provisions resources by real need, with a focus on cost) and KEDA (scales based on events, such as the size of a queue).
In the market (according to the material): iFood faces peaks on championship finals and rainy days and responds with microservices in the cloud, intensive autoscaling and queues to decouple order processing. The FinOps trend looks at scalability from the cost angle too; Karpenter provisions the exact resources using the cheapest instances available. Festival and sporting-event ticket sales taking sites down force the market to evolve in load balancing, bot protection and distributed caching via CDN.
Key concepts
Performance
latency of an isolated operation.
Throughput
how much work the system completes per unit of time.
Optimization
improves performance without adding resources; usually improves throughput as well.
Scalability
increases throughput by adding resources; does not reduce the latency of an isolated request.
Vertical scaling
a bigger server; simple, with a ceiling, downtime on upgrade and a SPOF.
Horizontal scaling
more servers; resilient and with a high ceiling, requires a prepared application and a load balancer.
SPOF
a component without redundancy whose failure brings down the whole system.
Elasticity and autoscaling
growing and shrinking automatically, by metric, by schedule or by prediction.
A "store" with limited capacity
To feel the difference between optimizing, scaling up and scaling out, we will use a test application that models a server with finite capacity: each instance serves at most N requests at the same time (CAPACIDADE), and each request takes a fixed time (TRABALHO_MS). Requests that exceed the capacity wait their turn. It is a model, not a real server, but it makes the numbers predictable. The /health path answers immediately, without simulating work. Create the folder and the files:
$ mkdir -p lab-escalabilidade/app && cd lab-escalabilidade
app/app.py:
Essential commands for this stage
000 means there was no response)Hands-on
Lab
1. Baseline: one instance, capacity 2, 100 ms per request.
docker run -d --name base -p 8081:8080 lab-appcurl -s -o /dev/null -w "latência de uma requisição: %{time_total}s\n" localhost:8081/carga http://localhost:8081/
Expected output (approximate values, your machine varies):
latência de uma requisição: 0.10xxxxsreal 0m5.2s
The math: 2 requests every 100 ms give 20 per second; 100 requests take about 5 seconds.
2. Optimization: same machine, half the work.
docker run -d --name otim -p 8082:8080 -e TRABALHO_MS=50 lab-appcurl -s -o /dev/null -w "latência: %{time_total}s\n" localhost:8082/carga http://localhost:8082/
Expected: latency near 0.05s and total time near 2.5 s.
3. Vertical scaling: a "bigger server" (capacity 4).
docker run -d --name vert -p 8083:8080 -e CAPACIDADE=4 lab-appcurl -s -o /dev/null -w "latência: %{time_total}s\n" localhost:8083/carga http://localhost:8083/
Expected: latency stays near 0.10s; total time near 2.5 s.
4. Horizontal scaling: three small instances, with a hand-made "balancer".
docker run -d --name h1 -p 8084:8080 lab-appdocker run -d --name h2 -p 8085:8080 lab-appdocker run -d --name h3 -p 8086:8080 lab-app# The request number modulo 3 picks port 8084, 8085 or 8086time (seq 1 100 | xargs -P 20 -I{} sh -c 'curl -s -o /dev/null http://localhost:$((8084 + {} % 3))/')
Expected: total time near 1.7 s (3 instances × 20 per second = 60 per second).
5. What to observe.
| Experiment | Latency of 1 request | Time for 100 requests |
|---|---|---|
| Base | about 0.10 s | about 5 s |
| Optimization | about 0.05 s | about 2.5 s |
| Vertical | about 0.10 s | about 2.5 s |
| Horizontal (3) | about 0.10 s | about 1.7 s |
Scaling (vertical or horizontal) did not change the latency of an isolated request, only the throughput. Optimizing changed both. This is exactly the distinction between performance and scalability.
6. The single point of failure, live.
docker stop basecurl -s -o /dev/null -w "%{http_code}\n" --max-time 2 localhost:8081/docker stop h1for p in 8084 8085 8086; do curl -s -o /dev/null -w "%{http_code} " --max-time 2 localhost:$p/; done; echo
Expected: 000 on the first call (connection refused: the SPOF went down) and 000 200 200 on the second. With the fleet, only a third fails. But whoever decides where to send the request is still your sh -c, which does not know h1 went down. In the next stage, the load balancer decides.
Cleanup:
docker rm -f base otim vert h1 h2 h3
Exercises
- Scale or optimize? For each situation, say which lever to use first and why: (a) a page runs 400 SQL queries in a loop; (b) the Black Friday campaign site will receive 20 times the normal traffic in 3 hours; (c) an internal system with 50 employees is slow on Monday mornings. *Expected answer:* (a) optimize, because the problem is the query and scaling would only multiply the waste; (b) scale horizontally, preferably with scheduled or metric-based autoscaling; (c) measure first, probably optimize, and avoid autoscaling as it is overkill in cost and complexity.
- Write the three rules. For a store with a predictable peak at 20:00, write a metric-based rule, a scheduled one and describe what a predictive one would do differently. *Expected answer:* (metric) "if the fleet's average CPU exceeds 70% for more than 5 minutes, add a server; if it drops below 30% for 10 minutes, remove one"; (scheduled) "every day at 19:50, scale up to the number of servers the peak requires, and at 22:00 scale down to the minimum"; (predictive) a Machine Learning model trained on the history learns the shape of the peak (for example, that Friday is stronger than Tuesday) and raises capacity before it begins, without depending on a hand-written time. The underlying difference: the metric rule reacts after the load has risen; the scheduled and predictive ones anticipate.
- Triangle. You need to cut the database latency in half. Name one solution that sacrifices cost and another that sacrifices complexity. *Expected answer:* sacrificing cost, top-end hardware for the database (vertical scaling: more RAM, faster disks), simple to operate but expensive, with a ceiling and a single point of failure; sacrificing complexity, one or more cache layers (for example, Redis) in front of the database, cheap per unit but with new problems (invalidation, stale data). Before either, it is worth checking whether a better query or index already solves it, because optimization costs little on all three vertices.
Tip: Before scaling, measure two things separately: the latency of one request alone and the time of a parallel batch. If the single request is already slow, the problem is one of performance and more servers will not solve it.
Takeaway: Scaling increases how much the system can handle (throughput), optimizing makes each task cost less; before buying a server, find out which of the two problems you have.
Stage 02 algorithms + failover
Load balancers in practice
The problem
You have three identical servers and a question: how does traffic reach them in an organized way? In Stage 01, your sh -c played the role of distributor and, when an instance went down, a third of the requests simply failed. In production, nobody wants the client deciding this alone, and nobody wants to take the site down to publish a new version on a Friday afternoon. This is where the load balancer comes in: it prevents overload, keeps the application up even if an instance fails and enables zero-downtime deploys, like those Netflix and Spotify do.
The concept
A load balancer is a proxy server between the clients and the application servers. It is the single point of contact and an abstraction: the client talks to just one address. Besides distributing requests, it ensures high availability, reliability and simplified management. The material compares it to the air traffic controller, who directs planes to free runways and keeps the operation going even with a runway closed.
Layer 4 vs layer 7 (OSI model):
External vs internal. The external one has a public interface (public IP or DNS) and is the application's entry gate. The internal one exists only inside the private network (VPC) and manages communication between services: the "Cart" talks to the "Stock" without exposing the Stock to the internet, which is a security gain.
Algorithms:
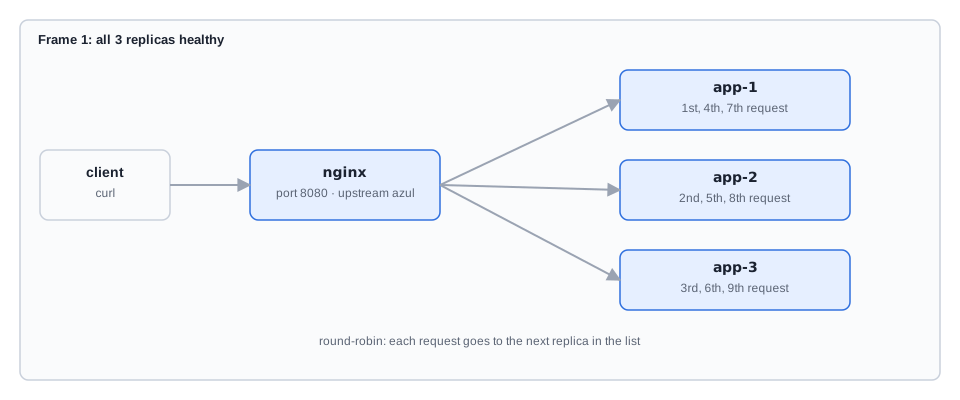
- Round-robin: circular list, next in line. Fair and predictable, but ignores load and capacity. The Weighted Round-robin variant gives higher weights to more powerful servers.
- Least Connections: sends to whoever has the fewest active connections. Good when connections have very different durations (uploads, streaming).
- IP Hashing: the hash of the client IP defines the server, so the same IP always lands on the same server (session affinity). Disadvantages: uneven distribution when many users are behind the same corporate proxy, and session problems if a server fails and the hash is recalculated.
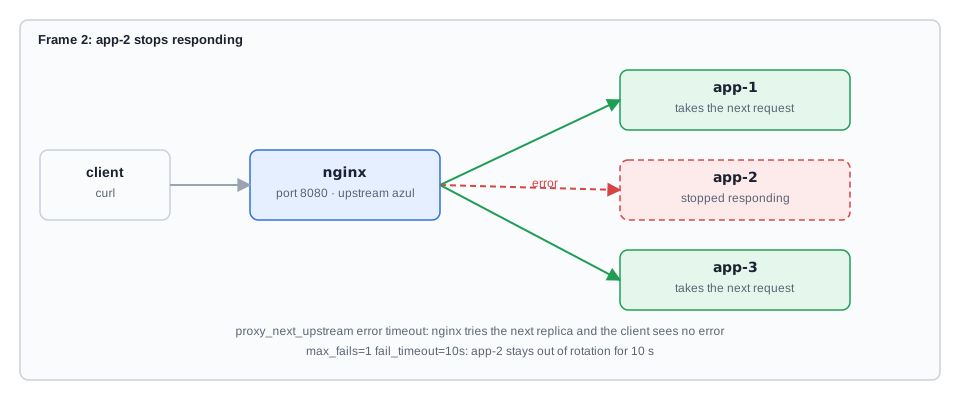
Health checks and failover. The LB actively tests the health of each server. Parameters: interval, timeout, *unhealthy threshold* (consecutive failures to mark as unhealthy) and *healthy threshold* (consecutive successes to come back). When a server fails, failover happens: the LB stops sending new traffic to the sick instance, transparently. Connection draining lets existing connections finish before the instance is removed.
Deploy strategies:
- Blue/Green: two identical, isolated environments. The LB sends 100% to Blue (stable); Green (the new version) is validated; the "switch" points everything to Green. Rollback is just as fast. Watch out for the shared database: schema changes must be backward compatible.
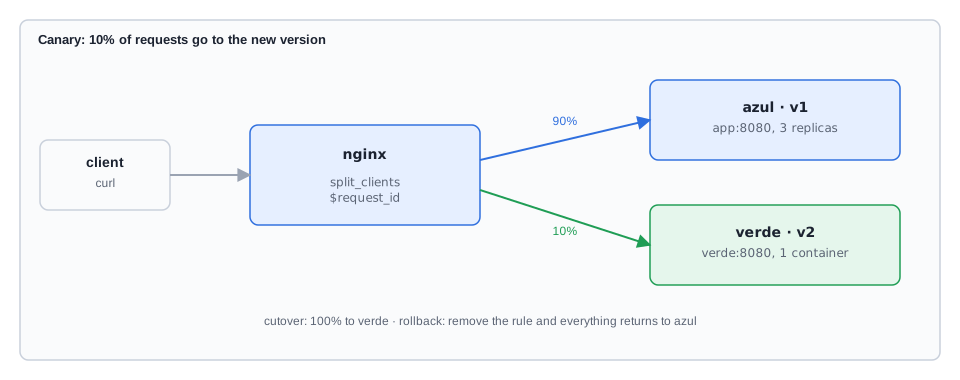
- Canary: name coming from the canaries used in coal mines. A small percentage (1%, 5%) goes to the new version; technical metrics (errors, latency) and business metrics (conversion, engagement) are monitored; it is increased gradually up to 100%.
In the market (according to the material): Netflix uses internal LBs to decouple thousands of microservices; if recommendations get slow, traffic goes to a fallback or circuit breakers are activated, avoiding cascading failure. Service Mesh and API Gateways (Istio and Linkerd, with sidecar proxies acting as per-service L7 LBs) bring observability, mTLS and granular control. GSLB (Global Server Load Balancing) uses smart DNS for multi-cloud and hybrid environments: the user in Brazil goes to São Paulo, the one in Europe to Frankfurt, according to geolocation, latency and health. Cloudflare and F5 are cited as leaders.
How the lab fits in. Nginx will play the role of the Application Load Balancer (L7). On AWS, the *listener* is the entry port, the *target group* is the group of destination servers and the *health check* decides who is healthy. In Nginx, listen is the listener, the upstream block is the target group and the health check is passive: open-source Nginx marks a server as failed when real connections to it fail. The active health check, which probes periodically, is a feature of NGINX Plus.
Key concepts
Load balancer
single entry point that distributes requests among servers.
L4
decides by IP and port; fast and blind to the content.
L7
decides by the HTTP content (path, headers, cookies); smarter and more expensive to process.
Round-robin, weighted, least connections, IP hash
the rules for choosing the next server.
Health check, failover, connection draining
detecting the sick server, taking it out of rotation and letting what was already in progress finish.
Blue/Green
full switch between two environments, with equally fast rollback.
Canary
a small fraction of traffic on the new version, increased gradually.
Ingress
the Kubernetes L7 router, which takes external traffic to the right services in the cluster.
Worked examples
$ mkdir -p etapa-02/nginx && cd etapa-02
docker-compose.yml:
Essential commands for this stage
docker compose ps -q app: list the containers (-q returns only the IDs)Hands-on
Lab
1. Round-robin. 30 requests, counting who answered:
for i in $(seq 1 30); do curl -s localhost:8080/; done | awk '{print $1}' | sort | uniq -c
Expected (the IDs change):
10 3f2a1b9c0d1e10 7c8d9e0f1a2b10 a1b2c3d4e5f6
Thanks to the zone directive, the Nginx worker processes share the same round-robin counter, which is why the split comes out exact. Without it, each worker would have its own counter and the distribution could come out uneven (for example, 12 for one and 9 for each of the others).
2. Failover. Take down one replica and keep calling:
docker stop $(docker compose ps -q app | head -n 1)for i in $(seq 1 20); do curl -s -o /dev/null -w "%{http_code}\n" localhost:8080/; done | sort | uniq -c
Expected: 20 200. No failure reached the client. The first request that lands on the stopped replica may take about 1 second (the proxy_connect_timeout) before Nginx tries another server. Compare with Stage 01, where 000 appeared.
Bring the replica back and refresh Nginx, which resolves names only at startup and so may hold an outdated IP:
docker compose up -ddocker compose exec lb nginx -s reload
3. Algorithms. Switch to least_conn and then to ip_hash. (On macOS, use gsed in place of sed, or edit nginx/default.conf by hand: insert the line least_conn; right below upstream azul { and, afterwards, replace it with ip_hash;.)
# Inserts "least_conn;" right after the opening of the upstream azul blocksed -i 's/upstream azul {/upstream azul {\n least_conn;/' nginx/default.confdocker compose exec lb nginx -t && docker compose exec lb nginx -s reload# Now switches to ip_hashsed -i 's/least_conn;/ip_hash;/' nginx/default.confdocker compose exec lb nginx -t && docker compose exec lb nginx -s reloadfor i in $(seq 1 10); do curl -s localhost:8080/; done | awk '{print $1}' | sort | uniq -c
Expected with ip_hash: a single line with 10 and a single server. Your client always has the same IP (the Docker gateway's) and so always lands on the same server: this is session affinity, and also the imbalance that happens when many people share an IP. Remove the line to go back to round-robin:
sed -i '/ip_hash;/d' nginx/default.confdocker compose exec lb nginx -s reload
4. Canary at 10%. Replace the contents of nginx/default.conf with:
upstream azul {zone azul 64k; # balancing state shared among the workersserver app:8080 max_fails=1 fail_timeout=10s;}upstream verde {server verde:8080;}# Draws the destination by each request's unique ID: 10% go to "verde", the rest to "azul"split_clients "${request_id}" $destino {10% verde;* azul;}server {listen 80;location / {proxy_pass http://$destino; # the group name comes from the drawn variableproxy_connect_timeout 1s;proxy_next_upstream error timeout;}}
docker compose exec lb nginx -t && docker compose exec lb nginx -s reloadseq 1 200 | xargs -P 10 -I{} curl -s localhost:8080/ | awk '{print $2}' | sort | uniq -c
Expected, approximately: 180 v1 and 20 v2 (the draw varies a little). If the v2 metrics got worse, only that 10% would feel it.
5. Blue/Green: the switch and the rollback. (On macOS, use gsed, or edit the file by hand: replace 10% with 100% for the switch and delete the verde line for the rollback.)
# Switch: 100% to the new versionsed -i 's/10% verde;/100% verde;/' nginx/default.confdocker compose exec lb nginx -s reloadfor i in 1 2 3 4 5; do curl -s localhost:8080/ | awk '{print $2}'; done# Expected: v2 five times# Rollback: removes the verde rule and sends everything back to azulsed -i '/% verde;/d' nginx/default.confdocker compose exec lb nginx -s reloadfor i in 1 2 3 4 5; do curl -s localhost:8080/ | awk '{print $2}'; done# Expected: v1 five times
nginx -s reload is graceful: the old processes finish the connections in progress before exiting. This is the idea of connection draining.
Exercises
Exercises 1 and 2 change nginx/default.conf with the stack running. The file is in the canary/rollback format (with split_clients), and it is its location / block that you replace in exercise 1. After editing, run docker compose exec lb nginx -t && docker compose exec lb nginx -s reload.
- L7 routing. Replace the
location /block with two:location /api/withproxy_pass http://verde;andlocation /withproxy_pass http://azul;. Callcurl -s localhost:8080/api/pagamentosandcurl -s localhost:8080/blog. Which version answers each one? Why is this only possible at L7? *Expected answer:*/api/pagamentosanswers withv2(theverdegroup) and/blogwithv1(theazulgroup). Only L7 can do it, because the/api/...path is inside the HTTP request, and L4 sees only IP and port. - Weights. What would be the effect of
server app:8080 weight=3;next to another server with weight 1, and in what real scenario would you use it? *Expected answer:* the weight-3 server would receive about 3 out of every 4 requests (ratio 3 to 1). It is Weighted Round-robin, useful when the machines are unequal and a more powerful server should receive more load than a smaller one. - Ingress (reading). In the YAML of the second worked example, which service serves
/api/pedidosand which serves/? *Expected answer:*/api/pedidosgoes to the Serviceapi;/goes toweb. It is the same reasoning as the Nginxlocationblocks.
Cleanup (when you finish the lab and the exercises):
docker compose down -vcd ..
Tip: Before every reload, run nginx -t. An invalid configuration makes the reload be refused and Nginx keeps the previous configuration, but -t shows the error and the line right away, instead of you discovering later that the change did not take effect.
Takeaway: The load balancer is the single entry point that distributes the load, takes sick instances out of rotation and lets you swap versions without taking anyone down.
Stage 03 stateless + queues
Horizontal scaling patterns in cloud architectures
The problem
We already have a load balancer and a fleet. But what good is a fleet of identical servers if each client can only be served by one specific server? A customer puts coffee in the cart, the load balancer sends the next request to another instance, and the cart shows up empty. And what if payment processing is much slower than the rest? Adding servers for everything is a waste. This stage looks inside the application.
There is a second scenario, the e-commerce on Black Friday: confirming an order involves validating the payment, reducing stock, issuing the invoice and sending an e-mail. Done synchronously, the user waits for all of it in front of a loading screen, and each server stays busy with work that did not need to happen at that moment.
The concept
Golden rule: stateless.
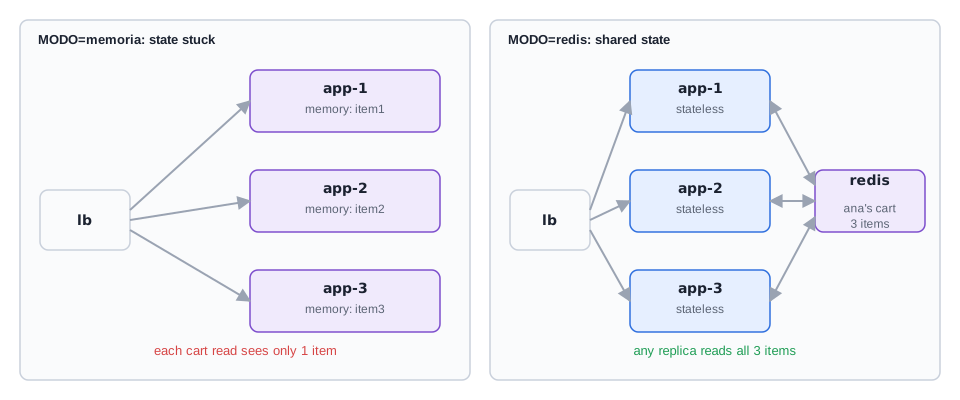
- Stateful: keeps session data in the server's memory (for example, the cart in a session variable). The client gets "stuck" to the server; if the load balancer sends it to another one, the cart vanishes. The workaround is *sticky sessions*, which limit resilience and the efficiency of balancing.
- Stateless: no context information stays on the server between requests; each request brings everything it needs. The state goes to a shared, fast storage (a database or a distributed cache such as Redis). Any server serves any client at any moment, which is compatible with horizontal scaling and automatic failover.
Scaling units. These are the mechanisms that keep the right number of copies running:
- Kubernetes ReplicaSet: guarantees a specified number of identical copies of a Pod always running.
- AWS Auto Scaling Group (ASG): manages the lifecycle of a group of EC2 instances, keeping the desired number healthy.
In Compose, the deploy.replicas field you used in Stage 02 plays a similar role, for local replicas.
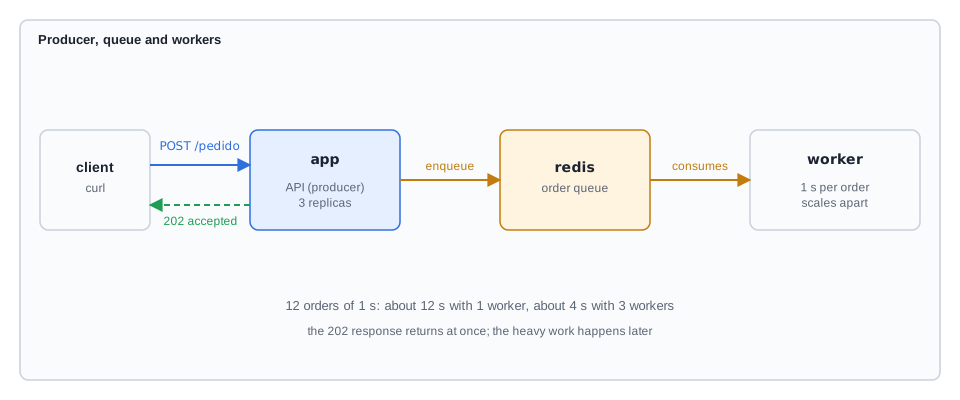
Workers and queues. The main application (the producer) publishes a message to a queue (AWS SQS, RabbitMQ) and answers right away ("Your order was received and is being processed"). The workers (consumers) read the queue and do the heavy work asynchronously. Workers scale independently of the API, based on the queue size.
Advanced patterns:
- Sidecar: helper container in the same Pod as the main one, handling logs, monitoring or network proxy without the application knowing.
- Ambassador: a proxy variation focused on communication with the outside or with other services (retries, service discovery).
- Sharding: horizontal scaling of data; the database is partitioned into smaller, independent databases (shards). Left for Stage 05.
Trade-offs and resilience. An aggressive autoscaling policy gives better performance and a high bill; a conservative one saves money and degrades at peaks. FinOps seeks the balance. In distributed systems failure is certain, which is why there are Retry with exponential backoff (trying again, waiting longer and longer between attempts) and Fallback (plan B, such as serving from the cache or a default response).
Tools and market (according to the material): KEDA (Kubernetes Event-driven Autoscaling) monitors the size of an SQS queue or the lag of a Kafka topic and scales workers from zero to N. Karpenter provisions exact, cheaper and suitable nodes at the moment. Netflix popularized the Circuit Breaker with the Hystrix library: repeated failures "open" the circuit, blocking calls to the failing service and going straight to the fallback; a failure in recommendations does not stop anyone from watching. Instagram and iFood use workers and queues for billions of uploads and millions of orders. Serverless (AWS Lambda) is the ultimate evolution of workers and queues: it scales from zero to thousands of executions and charges per execution. Istio and Linkerd implement Sidecar and Ambassador in a standardized way, with retries, timeouts, security and observability.
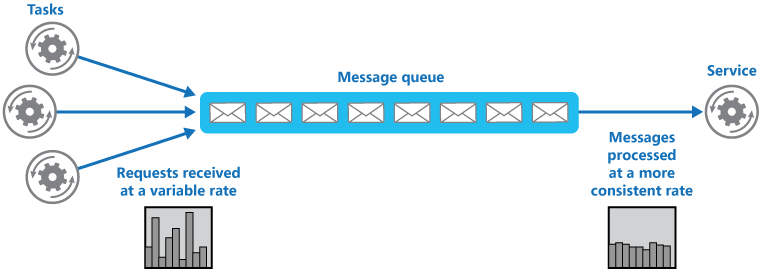
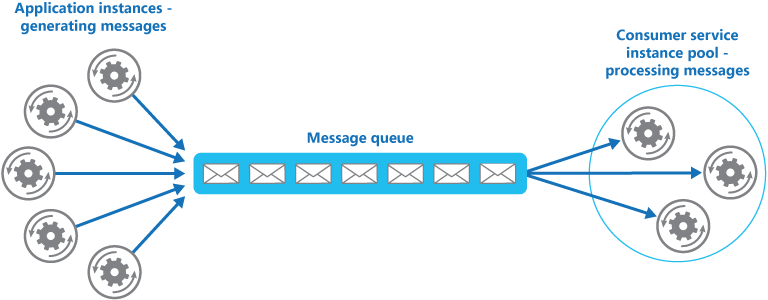
--scale worker=3.Diagram: Azure Architecture Center, Microsoft, CC BY 4.0Key concepts
Stateful
state in the server's memory; ties the client to it.
Stateless
state outside the server (Redis, database); any replica serves any client.
Sticky session
a patch that ties the client to a replica; the state still dies with it.
ReplicaSet and ASG
keep N identical, healthy copies.
Producer, queue and worker
answer right away and process the heavy work later.
Scaling by queue size
workers grow with the queue, independently of the API (the idea of KEDA).
Sidecar and ambassador
helper proxies next to the application.
Retry with backoff, fallback and circuit breaker
the mechanisms for living with failures.
Worked examples
We will replace the application with a complete version: cart in memory or in Redis, depending on the MODO variable; an order endpoint that enqueues and answers 202; and a worker. It keeps the Stage 01 behavior on / and /health. Replace app/app.py:
import jsonimport osimport socketimport threadingimport timefrom http.server import BaseHTTPRequestHandler, ThreadingHTTPServerfrom urllib.parse import parse_qs, urlparseHOST = socket.gethostname()VERSAO = os.getenv("VERSAO", "v1")MODO = os.getenv("MODO", "memoria") # "memoria" = stateful, "redis" = statelessTRABALHO = float(os.getenv("TRABALHO_MS", "100")) / 1000CAPACIDADE = threading.Semaphore(int(os.getenv("CAPACIDADE", "2")))memoria = {} # carts kept in the process (stateful)r = Noneif MODO == "redis":import redis # only imported when neededr = redis.Redis(host=os.getenv("REDIS_HOST", "redis"), port=6379, decode_responses=True)class Handler(BaseHTTPRequestHandler):def responder(self, status, corpo, tipo="text/plain"):dados = corpo.encode()self.send_response(status)self.send_header("Content-Type", tipo)self.send_header("Content-Length", str(len(dados)))self.end_headers()self.wfile.write(dados)def responder_json(self, status, dados):# every JSON says who answered (servidor) and in which modecorpo = json.dumps({"servidor": HOST, "modo": MODO, **dados}) + "\n"self.responder(status, corpo, "application/json")def do_GET(self):url = urlparse(self.path)q = parse_qs(url.query)if url.path == "/health":return self.responder(200, "ok\n")if url.path == "/carrinho":user = q.get("user", ["anonimo"])[0]# stateless: reads from Redis; stateful: reads from this process's memoryitens = r.lrange(f"carrinho:{user}", 0, -1) if r else memoria.get(user, [])return self.responder_json(200, {"user": user, "itens": itens})with CAPACIDADE:time.sleep(TRABALHO)self.responder(200, f"{HOST} {VERSAO}\n")def do_POST(self):url = urlparse(self.path)q = parse_qs(url.query)if url.path == "/carrinho":user = q.get("user", ["anonimo"])[0]item = q.get("item", ["?"])[0]if r:r.rpush(f"carrinho:{user}", item) # externalized stateelse:memoria.setdefault(user, []).append(item) # state tied to the processreturn self.responder_json(200, {"ok": True})if url.path == "/pedido":if r is None:return self.responder_json(503, {"erro": "sem fila (use MODO=redis)"})pedido = q.get("id", ["0"])[0]r.lpush("fila:pedidos", pedido) # producer: publishes to the queue and answers right awayreturn self.responder_json(202, {"pedido": pedido, "status": "recebido"})self.responder(404, "nao encontrado\n")def log_message(self, formato, *args):# records who served and the X-Request-ID (will be useful in Stage 06)print(f"[{HOST}] {self.command} {self.path} rid={self.headers.get('X-Request-ID', '-')}", flush=True)class Servidor(ThreadingHTTPServer):request_queue_size = 128if __name__ == "__main__":Servidor(("0.0.0.0", 8080), Handler).serve_forever()
Create app/worker.py (the consumer):
Essential commands for this stage
memoria): chooses the API mode before bringing up the stackHands-on
Lab
1. The problem: stateful cart.
export MODO=memoriadocker compose up -d --build# Three items, one per request; the LB distributes among the replicasfor i in 1 2 3; do curl -s -X POST "localhost:8080/carrinho?user=ana&item=item$i"; done# Now reads the cart three timesfor i in 1 2 3; do curl -s "localhost:8080/carrinho?user=ana"; done
Expected (IDs and order vary):
{"servidor": "aaa111", "modo": "memoria", "user": "ana", "itens": ["item1"]}{"servidor": "bbb222", "modo": "memoria", "user": "ana", "itens": ["item2"]}{"servidor": "ccc333", "modo": "memoria", "user": "ana", "itens": ["item3"]}
Each response has only one item. Ana's cart is spread across three memories and no replica sees it whole. This is the problem of state tied to the server. (The zone in the upstream makes the Nginx workers share the round-robin, so the six requests go through the three replicas in order and each read lands on the replica that received the corresponding item.)
2. The solution: state in Redis.
docker compose downexport MODO=redisdocker compose up -dfor i in 1 2 3; do curl -s -X POST "localhost:8080/carrinho?user=ana&item=item$i"; donefor i in 1 2 3; do curl -s "localhost:8080/carrinho?user=ana"; donedocker compose exec redis redis-cli LRANGE carrinho:ana 0 -1
Expected: the three responses show "itens": ["item1", "item2", "item3"], coming from different servers, and redis-cli lists:
1) "item1"2) "item2"3) "item3"
3. Failover without losing the cart.
docker stop $(docker compose ps -q app | head -n 1)curl -s "localhost:8080/carrinho?user=ana"
Expected: the cart is still complete. It may take up to about 1 second if the request lands on the stopped replica: open-source Nginx only notices the failure when it tries, and proxy_connect_timeout 1s limits the wait before it moves to another replica. Bring the replica back and refresh Nginx, which resolves names only at startup (the replica may come back with another IP):
docker compose up -ddocker compose exec lb nginx -s reload
4. Queue and workers. The order returns fast and the heavy work happens later:
# Turns on 1 worker (MODO stays exported, so the API is not recreated in another mode)docker compose up -d --scale worker=1# Enqueues 12 orders; each response arrives immediately with 202for i in $(seq 1 12); do curl -s -o /dev/null -w "%{http_code} %{time_total}s\n" -X POST "localhost:8080/pedido?id=$i"; done# Queue sizedocker compose exec redis redis-cli LLEN fila:pedidos
Expected: twelve lines like 202 0.00xs and an (integer) N with N between 1 and 11, because the worker is already consuming. Watch the worker working (Ctrl+C to exit):
docker compose logs -f worker
Expected output (shortened):
lab-etapa-03-worker-1 | [9f8e7d6c5b4a] processando pedido 1lab-etapa-03-worker-1 | [9f8e7d6c5b4a] pedido 1 concluido
5. Scale the workers by queue size. Wait for the previous step's queue to empty (LLEN equal to 0, about 12 s) so the measurement does not add old orders. Then measure the time to empty the queue with 1 worker and with 3:
# With 1 worker (12 orders of 1 s: near 12 s)for i in $(seq 1 12); do curl -s -o /dev/null -X POST "localhost:8080/pedido?id=$i"; donetime { while [ "$(docker compose exec -T redis redis-cli LLEN fila:pedidos | tr -d '\r')" != "0" ]; do sleep 0.5; done; }# With 3 workers (near 4 s)docker compose up -d --scale worker=3for i in $(seq 1 12); do curl -s -o /dev/null -X POST "localhost:8080/pedido?id=$i"; donetime { while [ "$(docker compose exec -T redis redis-cli LLEN fila:pedidos | tr -d '\r')" != "0" ]; do sleep 0.5; done; }
The workers scaled independently of the API, and it was the queue size that justified the scaling. This is the idea of KEDA.
Exercises
Exercises 1 and 3 need the stack running: export MODO=redis in exercise 1 and export MODO=memoria in exercise 3. To switch modes, run docker compose down, export the new value and docker compose up -d.
- KEDA by hand. Suppose each worker processes 1 order per second and you want to empty the queue within 4 seconds. Write the formula for the number of workers as a function of
LLEN(round up) and test it with--scale. *Expected answer:*workers = ceil(LLEN / 4), because each worker handles 4 orders in 4 seconds. In Bash,n=$(( (LLEN + 3) / 4 )). WithLLENequal to 12, that is 3 workers (docker compose up -d --scale worker=3) and the queue empties in about 4 seconds. This is the logic KEDA automates. - Retry with exponential backoff. Run the script below against a port where nothing is listening. During the wait, in another terminal, start
docker run -d --rm -p 9999:8080 lab-appand watch the script succeed.*Expected answer:* lines likefor tentativa in 1 2 3 4 5; do# --fail treats an HTTP error as a failure; --max-time 2 limits the wait of each attemptif curl -sf --max-time 2 -o /dev/null http://localhost:9999/health; thenecho "ok na tentativa $tentativa"; breakfiespera=$((2 ** (tentativa - 1))) # waits 1, 2, 4, 8, 16 secondsecho "tentativa $tentativa falhou, esperando ${espera}s"sleep "$espera"donetentativa 1 falhou, esperando 1s,tentativa 2 falhou, esperando 2s, and so on, untilok na tentativa Nappears on the first attempt after the container starts. The interval doubles with each failure, so the script keeps trying without hammering the service. If you do not start the container, all five attempts fail and the script ends without theokline. At the end, stop the test container withdocker stop $(docker ps -q --filter publish=9999). - Sticky session, the patch. With the stack in
MODO=memoria, addip_hash;to theupstream backendinnginx/default.conf(right below the lineupstream backend {), rundocker compose exec lb nginx -s reloadand repeat the cart test from step 1 with a new user (for example,user=bia). Does it work? Now take down the replica that served (the"servidor"field of the response is the container's short ID:docker stop ID) and read the cart again. What happened, and why does this limit resilience? *Expected answer:* withip_hash, all requests from your client (always the same IP) land on the same replica, so the three reads show["item1", "item2", "item3"], always with the same"servidor": the patch works as long as that replica lives. Afterdocker stop, the next read is diverted to another replica (possibly with about 1 s of waiting) and comes back with"itens": []. The cart lived in the memory of the replica that went down and died with it. Sticky session does not take the state out of the server, it only hides the problem: the failure of one instance still loses the data of the clients tied to it, and the load is distributed by IP, not by capacity. When done, delete theip_hash;line, rundocker compose up -dto recreate the replica anddocker compose exec lb nginx -s reload. - ReplicaSet (reading). In the YAML of the second worked example, map each field to Compose: which is the
replicas, which is the image, and what has no direct equivalent? *Expected answer:*spec.replicas: 3corresponds todeploy.replicas: 3; theimageinsidetemplate.spec.containerscorresponds to the service'simage:; the wholetemplateis the mold, like the definition of a service in Compose;metadata.nameplays the role of the service name;containerPort: 80documents the port, like the Dockerfile'sEXPOSE. TheselectorwithmatchLabelshas no equivalent that you write in Compose: there the replicas are grouped by the service name, while in Kubernetes the ReplicaSet finds "its" Pods by the labelapp: carrinho.
Cleanup (when you finish the lab and the exercises):
docker compose down -vunset MODOcd ..
Tip: To find out whether an application is stateless, run this lab's test: write something in one request, take down the replica that served and read in the next one. If the data vanished, there is state tied to the process, and no adjustment to the load balancer will fix that.
Takeaway: If the state lives on the server, the server cannot die or be replaced; take the state out (Redis, database) and take slow work out of the response path (queue and workers).
Stage 04 edge caching
CDNs and global performance
The problem
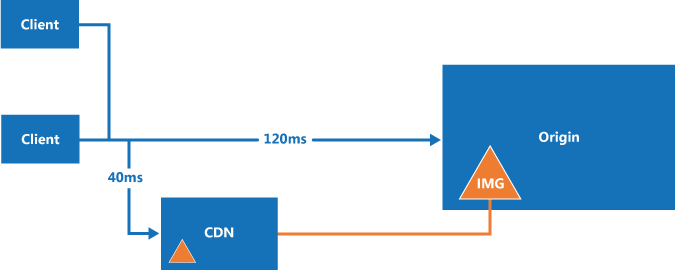
Your servers are in Brazil and work well for local users. But a customer in Lisbon, Tokyo or New York suffers from the latency imposed by distance and undersea cables: hundreds of milliseconds before processing even begins. No powerful server beats physics, because latency depends on the speed of light and the distance. The way out is to bring the content closer to the user, and that is what a CDN (Content Delivery Network) does. It is also a layer of security and scalability, because most requests never reach your origin.
The concept
A CDN is a global network of proxy servers installed at internet exchange points (IXPs), called PoPs (Points of Presence) or Edge Locations, which keep copies of the content close to the user. The server where the original content lives is the origin.
How it works:
- Geolocation via DNS. The DNS query goes to the CDN's smart DNS, which identifies the location by the IP and returns the IP of the nearest PoP, instead of the origin's IP.
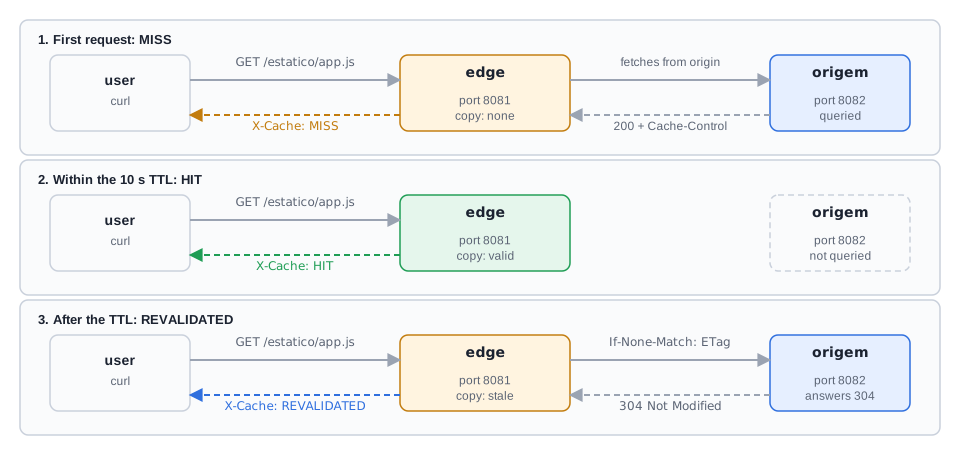
- Edge caching. The PoP (for example, Paris) checks the local cache. The first time there is a Cache Miss: it fetches from the origin in Brazil, delivers and keeps a copy. The next user in the region gets a Cache Hit, served instantly from the edge.
Cache control. Who decides how long a copy is valid is the origin, through the Cache-Control header. max-age defines the TTL in seconds: Cache-Control: public, max-age=3600 keeps it for one hour. Once expired, the file becomes *stale* and is revalidated with the origin; if it has not changed, the origin answers 304 Not Modified and the CDN renews the TTL without downloading the file again. To ask "did it change?", the ETag is used, an identifier of the file version, sent back in the If-None-Match header.
Invalidation (purging). It is forcibly removing files from all caches, through a panel or API (for example, for an urgent bug fix in a JavaScript file). Use it with judgment: it can cost money and reduces cache efficiency.
Beyond static assets. CDNs also scale APIs: GET responses that change little (a product catalog) can be cached at the edge, relieving the application and the database. Players cited: Amazon CloudFront, Akamai and Fastly.
Security and performance at the edge:
- WAF integrated into the CDN blocks SQL Injection and XSS at the edge.
- TLS Offload: the CDN performs the TLS handshake (CPU-expensive) on the optimized edge servers and keeps an optimized secure connection to the origin.
Infrastructure and observability. CDNs use BGP to announce the most efficient routes to their PoPs and peering agreements (direct connections with large providers) to reduce hops. The main metrics are the Cache Hit Ratio (the most important), bandwidth savings, response latency and error rate.
In the market (according to the material): Fortnite and League of Legends patches (tens of GB) are pre-positioned at the PoPs days before launch. Edge Computing (AWS Lambda@Edge, Cloudflare Workers) runs code at the PoPs: rendering, A/B tests, image manipulation, authentication at the edge. Dynamic Content Acceleration (Akamai, Fastly) speeds up even non-cacheable content with TCP/IP optimization and smart routing (BGP and peering).
How the lab fits in. A real CDN has hundreds of PoPs, but the mechanism of one PoP is a proxy with a cache. We will set up two Nginx instances: the origin (which defines the Cache-Control) and the edge (which caches and reports the result in the X-Cache header). In CloudFront, the *Origin* is the origin, the *Behavior* is the rule for handling and cache time by request type, and the domain provided by the CDN is the edge. The lesson also uses the browser's developer tools as a "performance detective"; here the detective is curl.
Key concepts
CDN, PoP and origin
network of caching proxies close to the user, in front of the original server.
Smart DNS
returns the IP of the PoP closest to the user.
Cache miss and cache hit
the edge had to go to the origin, or answered with the stored copy.
Cache-Control and max-age
the origin defines whether and for how long the response can be stored.
ETag, If-None-Match and 304
revalidation without downloading the file again.
Invalidation (purge)
erasing copies before the TTL; useful, but generates new misses.
Cache hit ratio
hits / (hits + misses), the main metric of a CDN.
WAF and TLS offload
security and encryption handled at the edge.
Origin and edge
$ mkdir -p etapa-04/origem etapa-04/edge etapa-04/site/estatico && cd etapa-04$ echo 'console.log("v1");' > site/estatico/app.js$ echo '<h1>Loja</h1>' > site/index.html
docker-compose.yml:
Essential commands for this stage
Hands-on
Lab
1. Performance detective at the origin. Inspect the headers:
curl -sI http://localhost:8082/estatico/app.js
Expected (shortened):
HTTP/1.1 200 OK...ETag: "6650a1b2-14"Cache-Control: public, max-age=10
2. The 304 happening. Get the ETag and ask "did it change?":
ETAG=$(curl -sI http://localhost:8082/estatico/app.js | tr -d '\r' | awk 'tolower($1)=="etag:" {print $2}')curl -sI -H "If-None-Match: $ETAG" http://localhost:8082/estatico/app.js
Expected: HTTP/1.1 304 Not Modified, with no body. The server confirmed the copy is still valid without resending the file.
3. Miss and hit at the edge.
for i in 1 2 3; do curl -s -D - -o /dev/null http://localhost:8081/estatico/app.js | tr -d '\r' | grep -i '^x-cache'; done
Expected:
X-Cache: MISSX-Cache: HITX-Cache: HIT
4. Cache Hit Ratio. Twenty requests and the count:
for i in $(seq 1 20); do curl -s -D - -o /dev/null http://localhost:8081/estatico/app.js | tr -d '\r' | grep -i '^x-cache'; done | sort | uniq -c
Expected: 20 X-Cache: HIT if you ran it right after step 3 (within the 10 s TTL). If more than 10 s have passed, the result is 1 X-Cache: REVALIDATED and 19 X-Cache: HIT: the edge already has the copy, so the first response after the TTL revalidates with the origin, and MISS does not appear (MISS only happens when the edge has nothing stored, as in step 3). Count the REVALIDATED as a trip to the origin: the hit ratio is 20 of 20 (100%) or 19 of 20 (95%). Confirm that the origin was barely bothered:
docker compose logs origem | grep 'app.js' | wc -l
Expected: 4 or 5. The math is this:
- 3 lines from the
curl -sIyou sent straight to the origin, on port 8082 (one in step 1 and two in step 2); - 1 line from the edge, the
MISSof step 3; - plus 1 line only if the TTL expired and there was a revalidation (the
304).
What matters: of the 20 requests in this step, the origin saw at most one.
5. Expiry and revalidation. Wait for the TTL to pass and ask again:
sleep 11curl -s -D - -o /dev/null http://localhost:8081/estatico/app.js | tr -d '\r' | grep -i '^x-cache'docker compose logs origem | grep 'app.js' | tail -n 3
Expected: X-Cache: REVALIDATED and, in the origin logs, a line with 304. The edge asked, the origin answered "not changed" and the TTL was renewed without transferring the file.
6. A file that changed: expires and downloads again.
echo 'console.log("v2");' > site/estatico/app.jscurl -s http://localhost:8081/estatico/app.js # still v1, within the TTLsleep 11curl -s -D - http://localhost:8081/estatico/app.js | tr -d '\r' | grep -iE '^x-cache|console'
Expected: the first call shows console.log("v1"); (edge copy, still valid). After the TTL, X-Cache: EXPIRED and console.log("v2"); appear. Between the change and the end of the TTL, users saw the old version: this is the staleness window that every TTL accepts. If the first call already shows v2, the TTL from the previous step had expired; repeat the step with a new edit.
7. Simulated invalidation (purge). Open-source Nginx has no purge API; we simulate it by erasing the cache. First fill the cache, then "invalidate":
echo 'console.log("v3");' > site/estatico/app.jscurl -s http://localhost:8081/estatico/app.js # v2 or v3, depending on the cache statedocker compose exec edge sh -c 'rm -rf /var/cache/nginx/edge/*'docker compose restart edgecurl -s -D - http://localhost:8081/estatico/app.js | tr -d '\r' | grep -iE '^x-cache|console'
Expected: X-Cache: MISS and console.log("v3");, right away, without waiting for the TTL. A real CDN does this through an API or panel, and that is why invalidating too much costs efficiency: each purge forces a new miss.
Exercises
Exercises 1 and 2 need the stack running. After editing origem/default.conf, run docker compose exec origem nginx -s reload.
- Cache the API. In
origem/default.conf, addadd_header Cache-Control "public, max-age=60";in thelocation /api/and reload. Make 10 calls tolocalhost:8081/api/produtosbefore and after the change, looking atX-Cache. What changes? What kind of API response is safe to cache this way? *Expected answer:* before, the 10 calls show asMISS, because the response carries noCache-Controland the edge does not store it (the origin is queried every time); after, the first isMISSand the next 9 areHIT(within the 60 s). It is safe for public GET responses, equal for all users and that change little, like the product catalog; it does not suit personalized responses. - When not to cache. Change the value to
Cache-Control "private, no-store". DoesX-Cachego back toHIT? Why should a logged-in user's data not stay on a shared edge? *Expected answer:* no. After the 60 s copy from the previous exercise expires (or is erased, as in step 7), the calls go back toMISS, becauseno-storeforbids the edge from storing the response. A logged-in user's data on a shared edge could be delivered to another person, andprivateindicates that only the user's own browser may store it. - How much to cache? For each item, choose a TTL and justify it: company logo, versioned JavaScript bundle, product catalog, user's bank balance. *Expected answer (examples):* company logo, long TTL (days), because it almost never changes; versioned JavaScript bundle, very long TTL (months), because the file name changes with each version and the copy is never stale; product catalog, short TTL (seconds to a few minutes), accepting a small staleness; bank balance, do not cache (
private, no-store), because it is personal data and changes all the time. - Conceptual. Explain, in three sentences, why the CDN's smart DNS makes the user in Lisbon talk to the Paris PoP and not to the server in Brazil. *Expected answer:* when the browser asks for the site's address, the query reaches the CDN's smart DNS. That DNS identifies the user's location by the IP and returns the IP of the nearest PoP (Paris), instead of the origin's IP. The browser then connects to that PoP, which answers from the cache (hit) and only goes to Brazil if it does not have the copy (miss).
Cleanup (when you finish the lab and the exercises):
docker compose down -vcd ..
Tip: For static files, prefer versioned names (for example, app.3f9c.js) with a long TTL over short TTLs with frequent purges. When the content changes, the name changes, and the old copy simply stops being requested, with no invalidation and no staleness window.
Takeaway: The CDN is cache close to the user; what rules it is the origin's Cache-Control, and the metric that matters is the Cache Hit Ratio.
Stage 05 replicas + cache + CAP
Database scalability
The problem
The application is scaled, there is a load balancer and there is a CDN. But almost every relevant action (purchase, post, search) reads or writes data, and everything points to a single place: the database, the hardest part to scale. It is stateful and needs consistency, so you cannot simply "turn on three more" as we did with the API: three independent databases would have three versions of the stock. On a Black Friday, the overloaded relational database is usually exactly the point that takes everything down.
The concept
The three challenges:
- Consistency: an atomic transaction, and subsequent reads seeing the correct result.
- Concurrency: multiple simultaneous accesses without corrupting data.
- Latency: fast operations even with more volume.
Scaling reads. The read-to-write ratio is usually high (for example, 100 to 1). Two tools:
- Caching (Redis, Memcached) between the application and the database: the first line of defense. The cache-aside pattern works like this: the application tries the cache; on a *miss*, it fetches from the database and writes to the cache before returning.
- Read Replicas: primary-replica model (formerly called master-slave). The primary receives all writes (INSERT, UPDATE, DELETE) and replicates them, usually asynchronously, to read-only replicas. The application implements write splitting: writes to the primary, reads distributed among the replicas.
Scaling writes. Even with replicas, all writes still go to one server. The solution is sharding (horizontal partitioning): the data is split among smaller, independent databases, each responsible for a part.
- By range (A to M in shard 1, N to Z in shard 2): simple, but creates *hotspots* if the distribution is not uniform.
- By hash (hash of the user ID): a more even distribution, but makes range queries harder.
The complexity is immense, especially in re-sharding (changing the number of shards and redistributing the data).
Distributed databases. Amazon DynamoDB (NoSQL), CockroachDB (NewSQL) and Apache Cassandra (NoSQL) do sharding and replication transparently. In DynamoDB, the lesson's demonstration configures "read and write capacity units", that is, you declare how much read and write you expect.
CAP theorem (Eric Brewer). Three properties of a distributed system:
- Consistency: all nodes see the same data.
- Availability: every request receives a response, with no guarantee that it is the most recent write.
- Partition Tolerance: the system operates even with a communication break between nodes.
Since network partitions are inevitable, the real choice is what to do during one: prioritize consistency (CP) or availability (AP). Traditional relational databases tend toward CP; Cassandra chooses AP, which leads to Eventual Consistency: without new writes, the replicas converge, but for a while different nodes may return different values.
Strategy and resilience. Scaling vertically may still be the simplest and most effective up to a point; horizontal scaling is more complex, with a higher ceiling and more resilience. Automated failover promotes a replica to primary when the primary goes down. Two numbers defined by the business guide the design:
- RPO (Recovery Point Objective): how much data loss is tolerable. An RPO of 5 minutes means accepting the loss of the last 5 minutes of transactions.
- RTO (Recovery Time Objective): how long the system can be down. An RTO of 15 minutes means detection, failover and return must take less than 15 minutes.
They dictate the choice between synchronous and asynchronous replication and the level of failover automation.
In the market (according to the material): Google Spanner delivers strong global consistency with high availability using atomic clocks, and CockroachDB brings that idea to the market without Google's hardware. Serverless databases (Aurora Serverless, MongoDB Atlas Serverless, Neon for Postgres) separate compute from storage and scale down to zero. HTAP (SingleStore, TiDB) unites OLTP and OLAP in one system, avoiding ETL and allowing real-time analysis.
How the lab fits in. On Amazon RDS, creating a Read Replica takes a few clicks and AWS manages the asynchronous replication. Here you will do by hand, with Postgres, what RDS hides: a replica via asynchronous *streaming replication*. You will also apply cache-aside with Redis.
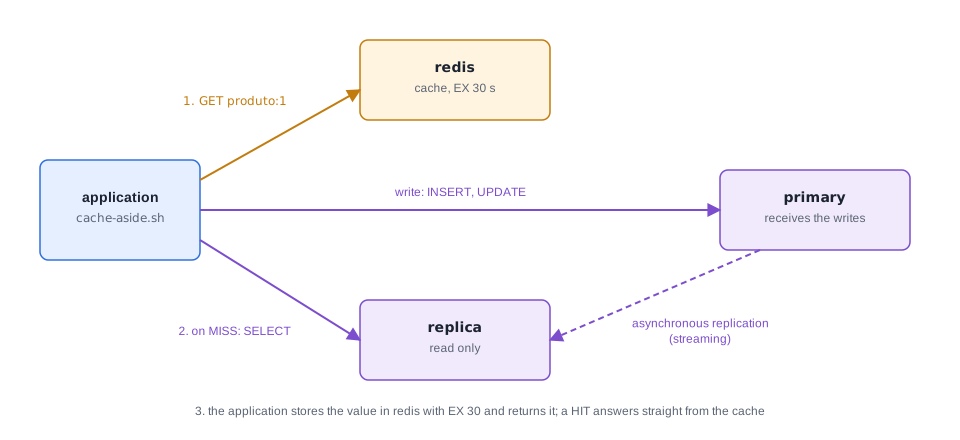
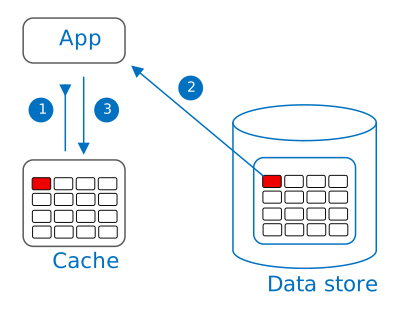
cache-aside.sh does.Diagram: Azure Architecture Center, Microsoft, CC BY 4.0Key concepts
Cache-aside
cache first; on a miss, database, and write to the cache before answering.
Primary and read replica
one node accepts writes; the replicas, only reads.
Asynchronous replication
the primary does not wait for the replica; it may fall a little behind.
Write splitting
the application sends writes to the primary and reads to the replicas.
Sharding by range and by hash
splitting the data to scale writes; range suffers from hotspots, hash makes range queries harder.
Re-sharding
changing the number of shards forces data to move.
CAP and eventual consistency
during a partition, you choose between consistency and availability.
Failover, RPO and RTO
promoting a replica; how much data you accept losing and how long you accept being down.
Worked examples
$ mkdir -p etapa-05 && cd etapa-05
init-primary.sh (runs once, when the primary is created):
Essential commands for this stage
f on the primary, t on a replicaSELECT pg_wal_replay_resume();: on the replica, pause and resume the application of changesSET chave valor EX 30, TTL and DEL: read, write with expiry, check the expiry and invalidate a keydocker network connect: simulate and undo a network partitionHands-on
Lab
1. Who is who.
docker compose exec primary psql -U postgres -c "SELECT pg_is_in_recovery();"docker compose exec replica psql -U postgres -c "SELECT pg_is_in_recovery();"
Expected: f on the primary and t on the replica (the replica is in recovery mode, that is, following the primary).
2. Replication is alive (and asynchronous).
docker compose exec primary psql -U postgres -c "SELECT client_addr, state, sync_state FROM pg_stat_replication;"
Expected:
client_addr | state | sync_state-------------+-----------+------------172.x.x.x | streaming | async
3. Write to the primary, read from the replica.
docker compose exec primary psql -U postgres -c "CREATE TABLE produtos (id int primary key, nome text); INSERT INTO produtos VALUES (1,'Camiseta'),(2,'Caneca');"sleep 1docker compose exec replica psql -U postgres -c "SELECT * FROM produtos;"
Expected: both rows appear on the replica.
4. The replica does not accept writes.
docker compose exec replica psql -U postgres -c "INSERT INTO produtos VALUES (9,'Intruso');"
Expected: ERROR: cannot execute INSERT in a read-only transaction. This is why the application needs write splitting.
5. Eventual consistency, live. Pause the application of changes on the replica, write to the primary and compare:
docker compose exec replica psql -U postgres -c "SELECT pg_wal_replay_pause();"docker compose exec primary psql -U postgres -c "INSERT INTO produtos VALUES (3,'Boné');"echo "primary:"; docker compose exec primary psql -U postgres -tA -c "SELECT count(*) FROM produtos;"echo "réplica:"; docker compose exec replica psql -U postgres -tA -c "SELECT count(*) FROM produtos;"
Expected: 3 on the primary and 2 on the replica. Now resume:
docker compose exec replica psql -U postgres -c "SELECT pg_wal_replay_resume();"sleep 1docker compose exec replica psql -U postgres -tA -c "SELECT count(*) FROM produtos;"
Expected: 3. For a while, two nodes answered different things and then converged: eventual consistency.
6. Cache-aside with Redis, reading from the replica. Use the cache-aside.sh from the second worked example:
bash cache-aside.sh 1bash cache-aside.sh 1bash cache-aside.sh 1docker compose exec redis redis-cli TTL produto:1
Expected: MISS Camiseta, then HIT Camiseta twice, and an (integer) between 1 and 30 (the seconds of life left on the key).
7. The price of the cache: stale data. The cache key lives only 30 s, so run this step right after step 6. If more time has passed, run bash cache-aside.sh 1 before the UPDATE to repopulate the cache; otherwise the stale data does not appear (you would see MISS Camiseta Azul directly). Change the data and read again:
docker compose exec primary psql -U postgres -c "UPDATE produtos SET nome='Camiseta Azul' WHERE id=1;"bash cache-aside.sh 1
Expected: HIT Camiseta. The cache serves the old value until it expires. Invalidate when writing:
docker compose exec redis redis-cli DEL produto:1sleep 1 # gives the replica time to receive the UPDATE (replication is asynchronous)bash cache-aside.sh 1
Expected: MISS Camiseta Azul. If MISS Camiseta appears, the read reached the replica before the change: this is the replication lag of eventual consistency. Repeat the DEL and the read. Whoever writes needs to invalidate the cache (or accept the TTL as the staleness window).
Exercises
Do the exercises in order: 2 and 3 change the lab's state.
- Sharding by hash, and the cost of re-sharding. Distribute 10 IDs into 2 shards by modulo (a very simple hash) and then see how many IDs change shard when moving to 3 shards:Expected:for id in $(seq 1 10); do echo "usuario $id -> shard $((id % 2))"; donemudou=0for id in $(seq 1 1000); do# compares the old shard (2 shards) with the new one (3 shards)if [ $((id % 2)) -ne $((id % 3)) ]; then mudou=$((mudou + 1)); fidoneecho "IDs que trocaram de shard: $mudou de 1000"
IDs que trocaram de shard: 667 de 1000. About two thirds of the data would need to migrate: this is the pain of re-sharding. Databases like Cassandra and DynamoDB do this work transparently. Question: and range sharding, what problem does it have? *Expected answer:* hotspots. As each shard receives a fixed range of values, if the data or the accesses are not evenly distributed across the ranges, one shard gets overloaded while the others sit idle. Two examples: in the A to M and N to Z split, names concentrated in certain letters weigh more on one side; in a split by range of increasing ID (or date), all new writes land on the last shard. In return, range makes range queries easy, which is precisely what hash makes hard. - Network partition (CAP in practice). Disconnect the replica from the network, write to the primary and read from both sides:Expected: the primary with one more row than the replica. The replica answered (availability) with outdated data (no consistency). Reconnect withdocker network disconnect lab-etapa-05_default $(docker compose ps -q replica)docker compose exec primary psql -U postgres -c "INSERT INTO produtos VALUES (4,'Chaveiro');"docker compose exec primary psql -U postgres -tA -c "SELECT count(*) FROM produtos;"docker compose exec replica psql -U postgres -tA -c "SELECT count(*) FROM produtos;"
docker network connect lab-etapa-05_default $(docker compose ps -q replica)and wait up to about 1 minute: the old replication connection may hang untilwal_receiver_timeoutexpires (60 s by default), and the replica may come back with another IP. To follow along, rundocker compose exec replica psql -U postgres -c "SELECT status FROM pg_stat_wal_receiver;"; when replication returns, the status isstreaming. Run thecount(*)again and check that the numbers converge. Question: if your priority were consistency, what should the replica have done during the partition? *Expected answer:* choosing consistency (CP), the replica should refuse the read, returning an error or leaving rotation, while it could not confirm it is up to date with the primary; the price is availability during the partition. The lab showed the other side, the choice for availability (AP): the replica answered with what it had, and the nodes converged afterwards (eventual consistency). - Manual failover and the RTO. Take down the primary and promote the replica:Expected:docker compose stop primarytime docker compose exec replica psql -U postgres -c "SELECT pg_promote();"docker compose exec replica psql -U postgres -c "SELECT pg_is_in_recovery();"docker compose exec replica psql -U postgres -c "INSERT INTO produtos VALUES (5,'Adesivo');"
pg_promotereturnst,pg_is_in_recoverybecomesfand the INSERT works. You have just done a failover. Questions: which part of the RTO was automatic, and which depended on you? With asynchronous replication, what may have been left behind at the moment of the crash (what RPO did you accept)? To restart the lab afterwards, rundocker compose down -vand bring everything up again. *Expected answer:* almost none of the RTO was automatic: noticing the outage, deciding to promote and runningpg_promotedepended on you (a managed service like RDS automates detection and promotion). As for the RPO, with asynchronous replication the transactions already confirmed on the primary that had not yet reached the replica at the moment of the crash are lost; on a local network that is usually little or nothing, but there is no guarantee, and that window is what the RPO measures. - RPO and RTO. The business defines an RPO of 5 minutes and an RTO of 15. Synchronous or asynchronous replication? Can the failover be manual? Justify. *Expected answer:* asynchronous replication is enough, because the business accepts losing up to 5 minutes of transactions, as long as the replica lag is monitored and stays within that limit; synchronous would only be needed if the RPO were close to zero. The failover can be manual if the team can detect, decide and promote comfortably within the 15 minutes (with on-call staff and a tested runbook); automating it reduces the risk of blowing the RTO and of human error, at the cost of more complexity.
Cleanup (when you finish the lab and the exercises):
docker compose down -vcd ..
Tip: After promoting a replica, do not turn the old primary back on as if nothing had happened. It may have transactions the replica never received and would start accepting writes in parallel with the new primary. The safe path is to rebuild it as a replica of the new primary.
Takeaway: Reads are scaled with cache and replicas; writes are only scaled by partitioning (sharding), and everything else is consciously choosing between consistency and availability.
Stage 06 observability
Scalable architectures in the real world
The problem
You have all the pieces (fundamentals, load balancer, patterns, CDN, database), but loose pieces are not an architecture. Consider the case of a fictional e-commerce: a traditional monolith, with application and database on the same server, went down on Black Friday. Where exactly was the failure? And, after rebuilding, how do you know where the next bottleneck is? This stage asks for the architect's view: the complete blueprint, each piece justified, and the instruments to see the system working.
The concept
Serverless. With AWS Lambda, we have maximum abstraction: the developer sends the function and the provider provisions, patches and scales. It is hundreds of executions per second, and the system goes back to zero (including the cost) when demand disappears.
Scalable monolith vs microservices:
Conway's law: the architecture reflects the communication structure of the organization. Small, autonomous teams tend toward microservices; centralized teams tend toward monoliths.
Where is the bottleneck? Observability. The bottleneck may be in CPU, memory, disk I/O, a query, a third-party API, network latency or a poorly configured cache. Without instruments, the investigation becomes guesswork. The three pillars:
What stitches the three together is a common identifier: the same request ID recorded in each layer it passes through. In the lab, it is the X-Request-ID header.
How the big ones do it (according to the material): Google has the SRE culture (operations as a software problem, automation, error budgets and SLOs). Amazon practices "you build it, you run it": each team operates and scales its own service. Nubank is cloud-native, with microservices, Clojure and Datomic for consistency in a distributed environment, a strong culture of automation and testing in a regulated business, and robust observability for explosive growth. The SRE trend replaces "Operations" teams with SRE, with SLOs, error budgets and the authority to prioritize stability when the error budget runs out. The Platform Engineering trend builds an Internal Developer Platform (IDP) with CI/CD, IaC, observability and security as a service, reducing the cognitive load on product teams.
SLO and error budget. The SLO is the reliability goal (for example, 99.9% availability in the month). What remains up to 100% is the error budget: while there is slack, the team can take more risks (frequent deploys, experiments); when the budget runs out, the priority becomes stability.
The case study: refactoring the e-commerce. The monolith with application and database on the same server went down on Black Friday. The points of failure: no load balancer, stateful application, overloaded database, no CDN. The redesign, step by step, ties together each stage of this guide:
Result: from a fragile architecture to a distributed, resilient and scalable system.
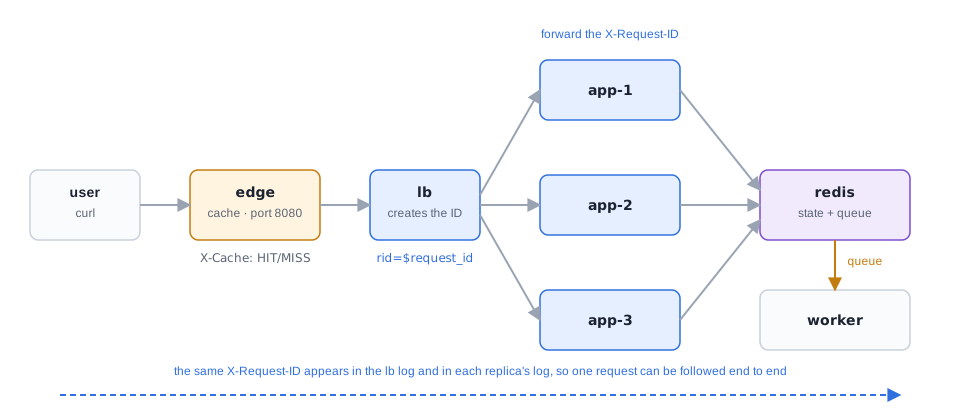
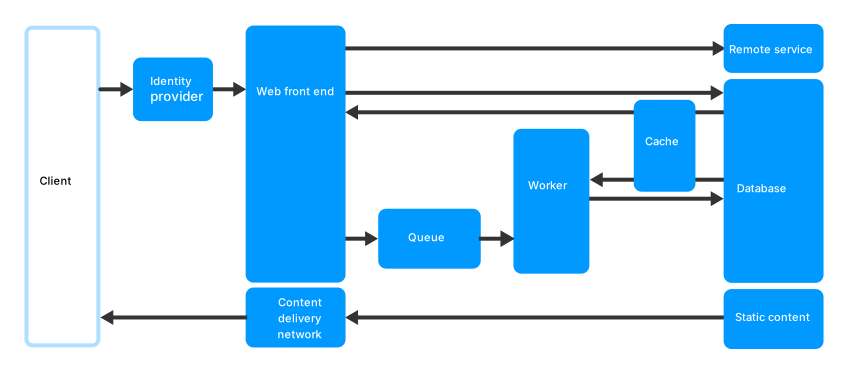
Key concepts
Serverless
the provider takes care of the server and scaling; the cost goes to zero without demand.
Scalable monolith
a single process, stateless, replicated behind a load balancer.
Microservices
services by business capability; granular scaling with high operational cost.
Conway's law
the architecture mirrors the organization.
Metrics, logs and traces
the what, the why and the where.
Request ID
the thread that links the same request across all layers.
SLO and error budget
the reliability goal and the slack it leaves.
Worked examples
We will assemble the "after" version of the case: edge (CDN) → load balancer → 3 stateless replicas → Redis (state and queue) → worker. The database part with a read replica you already built in Stage 05; it fits behind the API in the same way (exercise 5). Here the focus is the request chain and observability, so the compose does not get huge.
$ mkdir -p etapa-06/edge etapa-06/lb etapa-06/site/estatico && cd etapa-06$ echo 'console.log("loja");' > site/estatico/app.js
docker-compose.yml:
Essential commands for this stage
Hands-on
Lab
1. Bring up and verify.
docker compose up -d --buildsleep 3bash verificar.sh
Expected:
OK asset servido pela borda (HIT)OK requisições distribuídas em 3 réplicasOK carrinho visível em qualquer réplicaOK pedido aceito de forma assíncrona (202)
2. Resilience: take down a replica.
docker stop $(docker compose ps -q app | head -n 1)for i in $(seq 1 20); do curl -s -o /dev/null -w "%{http_code}\n" "localhost:8080/"; done | sort | uniq -c
Expected: 20 200. Bring it back and refresh Nginx, which resolves names only at startup (the replica may come back with another IP):
docker compose up -ddocker compose exec lb nginx -s reload
3. Before and after, in numbers. Use the load function from Stage 01 (redefine it if you opened a new terminal) against the architecture and against a single-instance "monolith":
carga() { time (seq 1 100 | xargs -P 20 -I{} curl -s -o /dev/null "$1"); }# After: edge, LB and 3 replicascarga http://localhost:8080/# Before: a single stateful instance, with no LB and no edgedocker run -d --name monolito -p 8090:8080 -e MODO=memoria lab-appcarga http://localhost:8090/
Expected: about 1.7 s against about 5 s. Now the single point of failure:
docker stop monolitocurl -s -o /dev/null -w "%{http_code}\n" --max-time 2 localhost:8090/
Expected: 000. Remove with docker rm monolito.
4. Observability: the three pillars with what we have.
*Metrics* (the what):
docker stats --no-stream
Expected: a table with CPU and memory for each container (NAME, CPU %, MEM USAGE / LIMIT...).
*Logs* (the why). The application records each request:
curl -s "localhost:8080/carrinho?user=ana" > /dev/nulldocker compose logs --no-color app | tail -n 3
Expected: lines like app-2 | [9f8e7d6c5b4a] GET /carrinho?user=ana rid=4c1d....
*Traces* (the where). Follow a request ID through the layers:
RID=$(docker compose logs --no-color lb | grep carrinho | tail -n 1 | grep -o 'rid=[a-f0-9]*')[ -n "$RID" ] || echo "nenhum rid encontrado: rode antes o curl do carrinho do passo anterior"echo "seguindo $RID"docker compose logs --no-color lb app | grep "$RID"
Expected: two lines with the same rid, one from the lb (with upstream= showing which replica was chosen) and another from the app (the replica that served). It is a mini distributed trace: the same identifier stitching the request's path through two layers. Real tracing tools do this automatically and measure the time of each segment.
Exercises
- Diagnosis. The e-commerce below went down on Black Friday. List the points of failure and, for each, the piece of the guide that solves it and in which stage it was studied: - application and database on the same server; - cart in a session variable; - images and JavaScript served by the application itself; - confirmation e-mail sent before responding to the customer; - a single server in front of everything. *Expected answer:* application and database on the same server: separate the two, with the application on its own instances and the database on a managed service with read replicas (Stages 01, 03 and 05); cart in a session variable: stateless application, with the state in Redis or in the database (Stage 03); images and JavaScript served by the application: CDN in front (Stage 04); e-mail before responding: queue and workers, with the producer responding right away (Stage 03); single server in front: load balancer with a fleet of instances (Stages 01 and 02).
- Monolith or microservices? A startup with 6 people, a single team, wants to "be like Nubank". Use Conway's law and the cost table to argue in favor of a scalable monolith (stateless, in an ASG) as a starting point. *Expected answer:* by Conway's law, a single, centralized team tends to produce (and to operate well) a monolith; microservices reflect small, autonomous teams, which the startup does not have yet. The table shows the price of microservices: massive operational complexity, latency and new points of failure in the network, hard distributed debugging. A stateless monolith in an ASG scales horizontally with simplicity of development, testing, deploy and debugging, and can be split later, when teams and bottlenecks arise that justify it.
- Bottleneck or pillar? You see the latency of
/carrinhotriple. Which pillar do you consult first to know *that* something changed, which to know *why* and which to know *where* the time was spent? *Expected answer:* metrics to know that something changed (and trigger the alert), logs to know why and traces to know where the time was spent, across the services the request passed through. - Error budget (calculation). An SLO of 99.9% availability over 30 days leaves how many minutes of unavailability in the budget? (Hint: 30 days have 43,200 minutes.) *Expected answer:* 0.1% of 43,200 = 43.2 minutes.
- Upgrade plan. Write what you would add to the
docker-compose.ymlto include the Stage 05 primary and replica databases behind the API, and how the application would do the write splitting. *Expected answer:* add to the compose theprimaryandreplicaservices (with theinit-primary.sh, thereplica.shand the Stage 05 healthcheck) and pass theappthe addresses of both through environment variables. In write splitting, write commands (INSERT, UPDATE, DELETE) go to theprimaryand reads (SELECT) to thereplica, preferably with the Redis cache-aside in front. The test application does not talk to Postgres, so a Postgres client would have to be added to it.
Cleanup:
docker compose down -vdocker rm -f monolito 2>/dev/nullcd ..
Tip: Generate the request ID in the first layer that receives the traffic and pass it along in all the following calls, recording it in every log. Without that common thread, logs from different layers are separate piles that you have to match by time, which does not work under load.
Takeaway: A scalable architecture is the right combination of simple pieces (edge, balancer, stateless application, queue, database with replicas), and it only stays that way if you can see the system through metrics, logs and traces.
Stage 07 · review
Self-assessment checklist
Stage 01: Fundamentals
- I explain the difference between performance, optimization and scalability with an example.
- I can say why scaling does not reduce the latency of an isolated request.
- I compare vertical and horizontal scaling, including the concept of SPOF.
- I tell apart metric-based, scheduled and predictive autoscaling.
- I recognize when NOT to scale.
Stage 02: Load balancers
- I tell L4 and L7 apart and give a use for each.
- I explain round-robin, least connections and IP hash, with one disadvantage of each.
- I describe health check, failover and connection draining.
- I run and explain a canary and a blue/green switch, with rollback.
- I configure an
upstreamin Nginx, validate it withnginx -tand reload the configuration.
Stage 03: Horizontal scaling patterns
- I explain why stateful gets in the way of balancing and how Redis solves it.
- I reproduce the in-memory cart problem and the fix.
- I explain why sticky session is a patch and not a solution.
- I explain the producer, queue and worker pattern, and why workers scale by queue size.
- I write a retry with exponential backoff and explain the role of fallback and circuit breaker.
- I know what sidecar, ambassador, ReplicaSet and ASG are.
Stage 04: CDNs
- I explain how smart DNS brings the user closer to a PoP.
- I read
Cache-ControlandETagwithcurland provoke a304. - I tell HIT, MISS, EXPIRED and REVALIDATED apart.
- I calculate the cache hit ratio and know why invalidating too much is bad.
- I decide what to cache, for how long, and what never goes to a shared edge.
Stage 05: Database
- I explain cache-aside and implement the flow with Redis, including invalidation on write.
- I explain primary-replica, asynchronous replication and write splitting.
- I demonstrate eventual consistency with a replica.
- I compare range and hash sharding and explain the pain of re-sharding.
- I explain the CAP theorem, RPO and RTO with an example.
Stage 06: Architectures in the real world
- I diagnose the points of failure of a monolith and redesign the architecture, justifying each piece.
- I compare scalable monolith and microservices and cite Conway's law.
- I associate metrics, logs and traces with the questions "what", "why" and "where".
- I run and interpret the verification of the complete architecture and follow a request ID through the logs.
- I explain SLO and error budget and calculate the budget of an SLO.
Teacher's notes: technical precisions
- Clarifications and corrections to the raw material:
- CAP theorem. The material says the system "guarantees only two of three" properties. The more accurate reading is that, during a network partition, you must choose between consistency and availability; without a partition, a system can offer both. That is why the material's own phrase "the real choice is CP or AP" is the one that holds, and the Stage 05 text was written in that sense. Classifying databases as "CP" or "AP" is also a simplification: many allow the behavior to be tuned by configuration.
- Hystrix. The material cites the Hystrix library as the one that popularized the Circuit Breaker. This is a correct historical fact, but the library is in maintenance mode (Netflix itself stopped developing it) and the Hystrix repository recommends alternatives such as Resilience4j. The pattern remains valid; the library is now a historical reference.
- `X-Cache` header. The material treats
X-Cache(Hit/Miss) as something the CDN simply sends. That header is not part of an HTTP standard: it is a convention of each provider, and the format of the value varies among them. What is standardized isCache-Control. In the lab,X-Cacheis defined by us at the edge. - ReplicaSet vs Deployment. The material presents the ReplicaSet as the scaling unit, which is correct. In practice, one usually creates a Deployment, which manages ReplicaSets and adds gradual updates and rollback. The ReplicaSet remains the mechanism that keeps the number of copies.
- Exponential backoff. In real systems, a small random delay (jitter) is usually added to the backoff, so that many clients do not all retry at the same instant.
- Changes from the previous version of the guide:
- Each stage now has the sections "Key concepts", "Essential commands" and "Tip". The reading YAMLs (Ingress and ReplicaSet) and the support scripts (
cache-aside.sh,verificar.sh) became worked examples of their own, and the exercises moved into "Hands-on". - The exercises that had none gained an expected answer: the retry with backoff and the sticky session in Stage 03, the ReplicaSet reading and the question about range sharding in Stage 05.
- In the sticky session exercise (Stage 03), the test uses a new user (
bia), becauseana's cart already has items spread across the replicas' memories since step 1, and it gained the step of undoing theip_hash. - In step 5 of Stage 03, the warning to wait for the step 4 queue to empty before measuring was added; without it, the measurement with 1 worker adds old orders and goes past the expected 12 s.
- Lab limits (where the local equivalence ends):
- The test application models a server's capacity with a semaphore and a
sleep. The Stage 01 numbers are predictable by construction; they serve to see the logic, not to measure real hardware. - Open-source Nginx does passive health checks (reacts to real failures). The ALB does active probing at a configurable interval, with *unhealthy threshold* and *healthy threshold*. Nginx also resolves server names only at startup, which is why the
reloadafter changing the fleet; in an ASG, registering and removing instances in the target group is automatic. - The
upstreamblocks usezone(shared memory) so that the several Nginx worker processes share the same round-robin state. Without it, each worker balances on its own and exact counts such as 10/10/10 may come out uneven. - The
sed -icommands with\nare GNU sed. On macOS (BSD sed), usegsed(brew install gnu-sed) or edit the files by hand. - The lab queue is a Redis list (
LPUSHandBRPOP). It has no acknowledgment: if a worker dies in the middle of a task, the message is lost. SQS and RabbitMQ keep the message until the consumer acknowledges it, and that guarantee is what the real pattern requires. - The local "CDN" is a single edge. It reproduces the mechanism (miss, hit, revalidation with
304, TTL), but not the geographic distribution, the smart DNS or the WAF. The purge is simulated by erasing the cache. - The lab Postgres uses asynchronous streaming replication, and the failover is manual. A managed service such as RDS automates detection and promotion; its real RTO depends on that automation.
- In Docker Compose,
deploy.replicasserves for local replicas. In production, the equivalent is the ReplicaSet/Deployment (Kubernetes) or the ASG (AWS), with real autoscaling. - References from the material:
- Beyer et al., *The Site Reliability Workbook* (2018) and *Site Reliability Engineering* (2016).
- Kleppmann, *Designing Data-Intensive Applications* (2017).
- Newman, *Building Microservices* (2015).
- Grigorik, *High Performance Browser Networking* (2013).
- AWS: *What is an Application Load Balancer?*, *Amazon CloudFront Developer Guide*, *Amazon Aurora Features*, *AWS Well-Architected Framework*.
- Kubernetes, *Ingress*; Karpenter and KEDA documentation; Cloudflare, *Load Balancing* and *What is a CDN?*; Cockroach Labs, *CAP Theorem*; Netflix Technology Blog.